Evaluating a thermal bridge
Important thermal characteristics of a construction part can be determined with a few mouse clicks. The automated and interactive evaluation of flixo allows you to generate customised reports and to visualize constructional weakness.
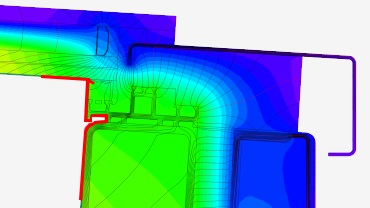
Isotherms, Temperature Distribution and Stream Lines
flixo displays isotherms, temperature distribution and stream lines for the whole construction or for a detail.
Configurable format properties.

Isotherms, temperature distribution and stream lines
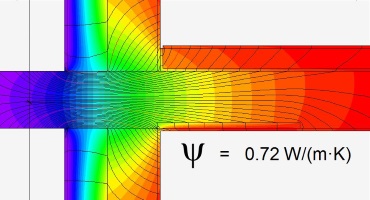
U-Values und Psi-Values
Calculation of the important thermal characteristics (U-Values und Psi-Values) with few mouse clicks.
Customizable appearance of results. Optional display of underlying dimensions, key values and formulas.
Mold, Surface Condensation and fRsi-Values
Calculation of the fRsi-value and the minimum surface temperature of any surface line requires only two mouse clicks.
Appearance and output of results is fully customizable.
Visualization of any condensation zone and areas with risk of mold.
Templates
Document templates automate and accelerate the creation of reports.
With document templates, you can design the reports according to your own ideas and adapt them to your company layout.
Preferably, you insert frequently used materials and boundary conditions in the document template. Thus, these data is available in all files derived from the document template.
Flexible Reporting with Wizards
Based on self-customized or ready-made templates, reports can be configured flexibly and completed with the flixo Wizards.
In addition to the representation of isotherms, temperature distribution, and stream lines, you can interactively retrieve and display further specific values after successful calculation.
Appearance of results is fully customizable.
Field functions
Field functions allow you to position and format a placeholder for page numbers, document information, file properties, model properties, and results. The placeholders are replaced by the actual values automatically after a successful calculation.

Some field functions: names and evluated results