Tools for the Thermal Bridge Analysis
There are several tools, wizards and functions available for analyzing the thermal bridges, for calculating key values and for creating customized as well standardized reports.
Equivalent U-Value
The equivalent U-value takes into account the effect of periodic thermal bridges.
A timber frame constructed wall or a rafter roof are typical constructions with periodically occurring thermal bridges.
With only three clicks of the mouse, you can calculate the equivalent U-value: With the first two clicks you set the cross section line, thus defining the surface edge over which the equivalent U value is to be calculated. After, you define with a third click the position of the measurement lines.
You can optionally show dimensions and heat flow.
The equivalent U value can be represented consolidated or with all calculation formulas.
Psi Value 2 Constructions
The Psi value takes into account the additional heat loss caused by a thermal bridge.
flixo requires just three mouse clicks for calculating the Psi value. The first two points define the surface line, through which the effective heat flow should be calculated (reference set of energy). You then have to define a third point (reference point), which divides the surface line in two parts with different U values.
The auxiliary variables (e.g. U values of the standard components) are determined automatically. They can be corrected if necessary.
You can optionally show dimensions and U values.
The Psi value can be represented consolidated or with all calculation formulas.
For complex cases (e.g. Psi value calculation in the ground according to EN ISO 10211) the wizard also has other models of computation.
Psi-Value 3 Constructions
With this flixo Wizard you can calculate Psi values of constructions, which have 3 connected components. Two thermal junctions are either identical (both Psi values are equal) or one connection is free of thermal bridges (one Psi value of one connection is zero).
Typical applications are spacer Psi values for mullion constructions or the Psi value of a window wall junction, if the glazing of the window is replaced by a panel according to EN ISO 10077-2.
To calculate and display the Psi value, four points are required: the first two points define the surface line, through which the effective heat flow should be calculated. The third and the fourth point (reference points) divide the surface line in 3 parts with different U values.
You can optionally show dimensions and U values.
The Psi value can be represented consolidated or with all calculation formulas.
For complex cases the wizard also has other models of computation.
Edge Psi-Value
Edge Psi values according to EN ISO 10077-2 are calculated for the thermal evaluation of spacers and glazing edges.
With the flixo Wizard the calculation of an edge Psi value happens in only two steps: First select the result object for which you want to calculate the edge Psi value, second select the file with the frame U value calculation
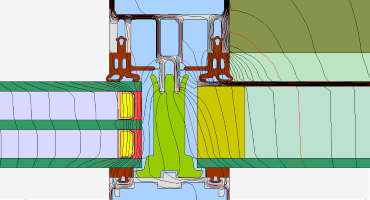
Isotherms
The representation of isotherms can be adapted to your individual needs:
- Display of isotherms with regular temperature separation
- Display of isotherms with freely definable temperatures
- Colors, styles
- Labels
Regular and special isotherms
By assigning a style of presentation you can easily change the representation of the isotherm. For example you can switch with one click from the style "All isotherms with integer temperatures" to the style "Isotherm with the temperature at which condensation occurs".
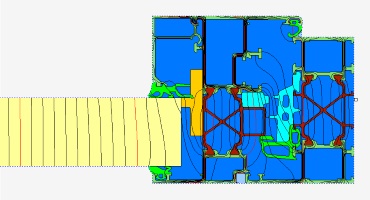
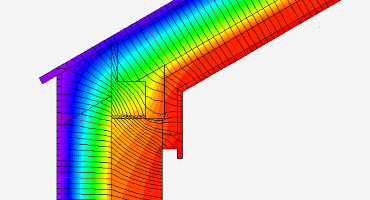
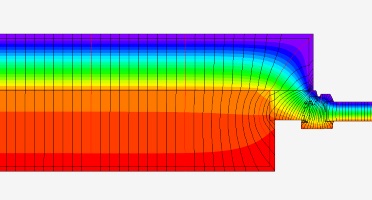
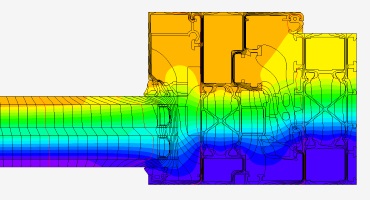
Temperature distribution
The temperature distribution shown as a false color representation allows you to make energy weak spots clearly visible.
The false color representation can be displayed in the background in addition to other properties.
You can assign a unique color to any temperature, or a unique color to a certain temperature distribution.
Temperature distribution
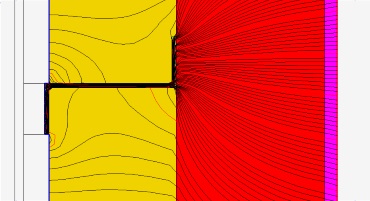
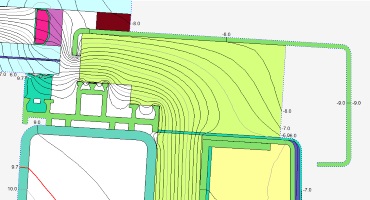
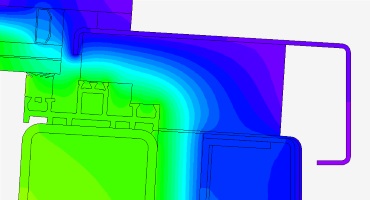
Streamlines
Stream lines can be represented to illustrate the energy flow.
The equidistance of the stream lines as well as line properties (color, weight, type, style) can be defined specifically.
Additionally the heat flux can be indicated as false color representation in the background.
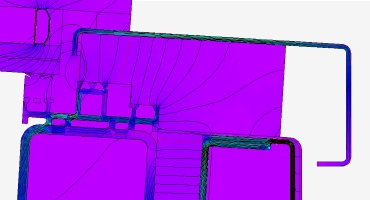
Streamlines and heat flux distribution
Minimum Surfacetemperatur, fRsi-Value, Condensation and Mold Risk
With the Min./Max. Temperature wizard you can determine the location with the lowest surface temperature. There is the greatest risk for condensation or mold formation.
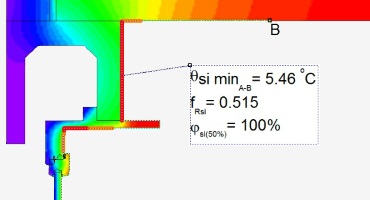
Room humidity and surface threshold humidity, where mold can develop, have relevance when calculating the surface moisture. You can customize them according to the specific conditions.
You can graphically show the zones with condensation and mold risk.
You can selectively display various characteristics of the defined surface line:
- Minimum surface temperature
- fRsi value - Surface humidity
- Room humidity for surface condensation
- Room humidity for mold risk
- Condensation zones
- Mold risk zones
Object Specific Resultats
Beside the representation of isotherms, temperature distribution and streamlines additional key values can be interactively determined and visualized for calculated models. The representation of the object specific results is fully adaptable.
With specialized wizards you can query and display beside the special U values and Psi values the following result objects:
- Temperature at any given point
- Minimum and maximum temperatures along a user defined surface line
- Heat flux which flows into or out a user defined surface line
- U-value of a section with parallel layers
- Equivalent U-value to take into account periodic thermal bridge occurrences
- Psi-value to take into account individual thermal bridges
- Dimensions to measure relevant distances
- Material Properties
Document Template Properties
Report Pages
At the draft stage, you can position on the report pages placeholders for result objects and determine their appearance properties.
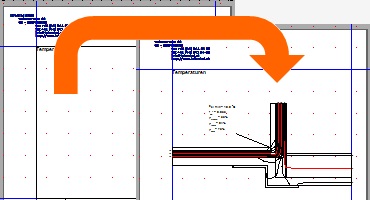
Report pages: Automtic replacement of the placeholders
After successful calculation of a construction this placeholders will be replaced by the real representation.
Frequently Used Data
Frequently used information, such as materials, boundary conditions and appearance properties of result objects can already be inserted into a template.
Thus, these data are all derived from the template files and need not always to be produced or imported from databases. In all files derived from the document template, these data and objects are available, and must not be created or taken from the database.
Styles
The presentation of the results is based on styles, similar to templates in the MS Office products. By styles you can set layout properties, number formats, fonts etc.
In flixo you can create any number of new styles and adjust existing ones. If the representation should be changed, either the style could be adjusted or a style with the desired properties could be assigned via drag and drop.