Description
The Min. / Max. Temperature tool lets you calculate and display the minimum, maximum and average surface temperatures, and the condensation zone along a surface line. For the minimum surface temperature spot, the fRsi factor, the surface humidity at a given humidity, and the critical humidity (point at which surface condensation forms, and/or at which predefined surface humidity is reached along with the temperature factor) are additionally calculated.
How do I activate it?
The Min. / Max. Temperature tool can be activate with the menu command Min./Max. Temperature in the menu Results or by clicking on the ![]() icon in the Toolbox flyout. When the tool is active, the mouse becomes a
icon in the Toolbox flyout. When the tool is active, the mouse becomes a ![]() in areas of possible start and endpoints.
in areas of possible start and endpoints.
How do I use it?
The desired surface line is defined by entering a start and an endpoint:
Click on the boundary point, where the surface line should begin. The boundaries of the construction, which come into question for the definition of the surface line, will appear as a dashed line. Move the mouse to the desired endpoint. The dashed line now highlights those parts, for which the minimum, average, and maximum surface temperature and the fRsi factor, the condensation zone, the surface temperature, and critical room humidities for the minimum temperature is calculated and shown. The surface line is defined as soon as you click on the endpoint.
If the SHIFT key is pressed while you define the surface line, then the first click sets the start and endpoints automatically at the adjacent adiabatic edges (e.g. construction sections).
If the start and endpoints lie on the exterior boundary of a construction, then flixo calculates the minimum and, optionally, the maximum surface temperature (cf. Min. / Max. Temperature style dialog window on the Extended tab) along with the critical room humidity for the line segment, which leads counterclockwise from the start to the endpoint; if the start and endpoint lie on an interior boundary (e.g. the interior boundary of an entire chimney), then the calculation for the line segment is a carried out clockwise.
The values of the minimum and maximum surface temperatures can be displayed at the corresponding positions, in addition with the minimum temperature spot, the fRsi factor, the surface humidity as well as the critical room humidity. The start and endpoint of the surface line segment will be labeled as well.
If you would like to interrupt the input process before defining the endpoint, then use the context menu command (right click) Cancel or hit the ESC key.
With the Select, Move, Scale tool or Edit tool respectively, you can change the position of the label along with the start and endpoints.
The style of the label (e.g. the number of post decimal place holders, display of maximum temperatures, display of average temperatures), the optional display of condensation zones humidity, as well as the graphical properties of the label lines can all be changed through the corresponding Style in the Styles flyout.
You can adjust the critical surface humidity and the humidity of the neighboring rooms, the consideration of the open air cavities in the calculation and the calculation style of the fRSi-Value, which influence the optional results, in the Properties flyout (cf. figure 1).
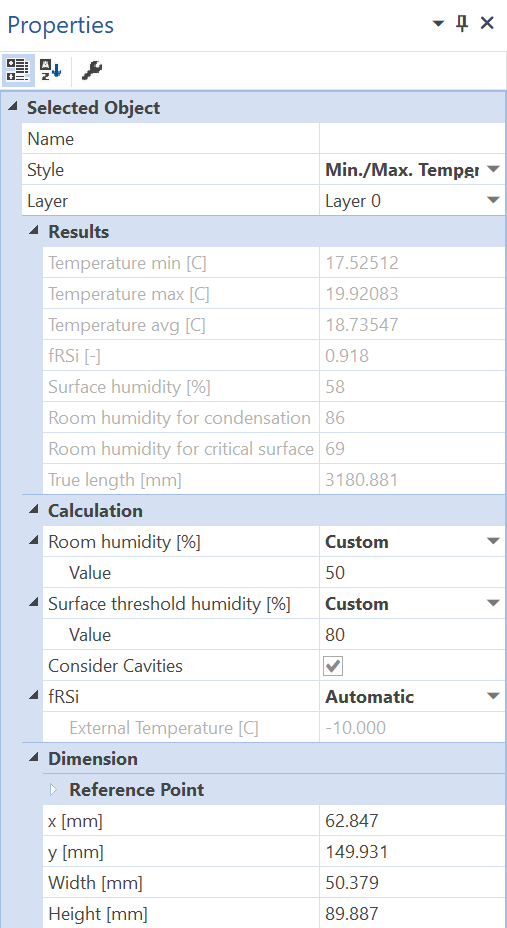
Figure 1: Properties flyout of a Min. / Max. Temperature object
Defining Styles
The presentation of a Min./Max. Temperature object can be defined in the Style list of the Min./Max Temperature tool properties (see figure 2). The list shows all styles for Min./Max. Temperature objects that have previously been determined in the Styles flyout.
A new Min./Max. Temperature object will always be created with the styles currently marked in the Style drop down list. You can either change the selection of the styles in the Styles flyout or in the Style drop down list from the Min./Max. Temperature tool properties.
The styles can be also be adjusted afterwards by using the Assign Properties tool or by using the Drag&Drop function (see lesson 1).
Figure 2: Min./Max. Temperature tool properties
Physical Explanation
In addition to the minimum temperature, the temperature factor, the surface humidity and the two critical room humidities can be displayed (cf. figure 3):
Temperature factor fRsi is calculated according to the following formula:
And the temperature factor fRsi* for problems with more than 2 boundary condition temperatures is calculated according to the following formula:
where:
θsi min: calculated minimum surface temperature according to the defined surface line segment [°C]
θi: interior boundary condition temperature [°C]
θe: exterior boundary condition temperature [°C]
θe min: lowest exterior boundary condition temperature [°C]
The external temperature, on which the calculation of the temperature factor fRsi is based, can be adjusted in the Properties Flyout (cf. Figure 1).
Surface humidity φsi(*%): This is the humidity on the surface of the minimum temperature point for the humidity given in the parentheses. The room humidity of the bordering room is defined in the Properties flyout. The surface humidity depends on the selected interior temperature and room humidity. Thus, the surface humidity must be respectively calculated for different interior temperatures and room humidities.
Room humidity φ100%, is shown where condensation forms. If the room humidity is equal or higher than the calculated room humidity φ100% (as in the example above 49%), then condensation forms at this spot. This value depends on the selected interior temperature and therefore the room humidity must be respectively calculated for different interior temperatures.
Room humidity φ80%, is shown at the surface temperature spot where the surface humidity is 80%. In the example above with a 39% room humidity, there would be an 80% humidity at that minimum surface temperature spot. This value depends on the selected interior temperature and therefore the room humidity must be respectively calculated for different interior temperatures.
The critical surface humidity (e.g. to analyse a potential mildew problem) as well as the room humidity can be adjusted in the Properties flyout.
 Limitations
•The Min./Max. Temperature tool can only be used on report pages, and only if a calculated model result object is present.
•The start and endpoints of the border line or the surface must be on the surface of the construction.
•The start and endpoints of the border line or the surface line must be able to be joined by a line.
•The critical room humidities and the surface humidity are only shown if the minimum temperature point is on a boundary segment with a temperature/h-value boundary condition, and the minimum temperature is lower than the adjacent room temperature.
•The temperature factor fRsi is only shown if there are exactly two boundary conditions in the model, and the minimum temperature is lower than the adjacent room temperature.
•The temperature factor fRsi* is shown if there are more than two boundary conditions in the model, and the minimum temperature is lower than the adjacent room temperature. In general, the temperature factor fRsi*cannot be used for other boundary condition temperatures.